5 Policy: Enhancing London’s Climate Resilience
5.1 Summary:
This weeks focus will be on policy application week, where Andy explored different examples of policy and their implementation. However, instead of focusing solely on learning, I found myself captivated by how Earth Observation can play a vital role in helping a city like London tackle its pressing climate challenges aligning with SDG’s
The aim of this exploration is to identify a specific urban policy and evaluate how Earth observation technologies can support its implementation. I chose the city of London, as my case study.
London has been actively working to enhance its climate resilience, a critical approach in the face of extreme weather events like heatwaves and storms. This effort encompasses a range of initiatives addressing key urban challenges:
Air Quality: Poor air quality in London is a significant concern, contributing to health issues such as asthma and cardiovascular diseases. Efforts to improve air quality include monitoring pollution levels and implementing green infrastructure to filter the air.
Flooding: Managing flood risk remains a priority for the city, particularly as heavy rainfall events become more frequent. By integrating sustainable drainage systems and strengthening flood defenses, London aims to mitigate the impact of flooding.
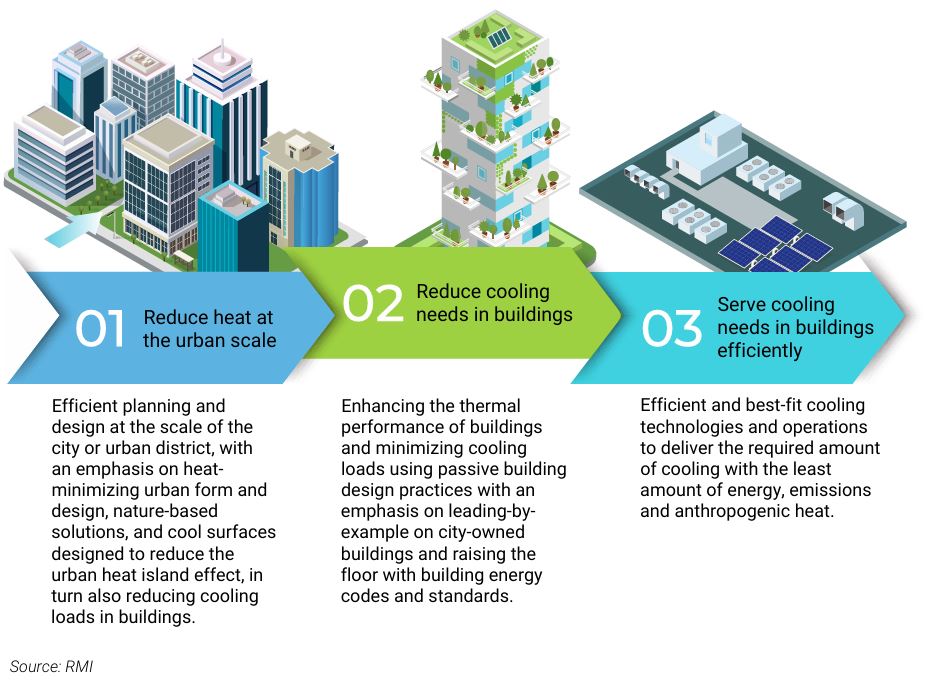
Urban Heat Island Effect: The densely built-up nature of London exacerbates the urban heat island (UHI) effect, where heat becomes trapped in concrete structures, intensifying heatwaves. This poses serious risks to vulnerable populations. Strategies to combat overheating include expanding urban greenery—such as parks, green roofs, and tree canopies—to provide natural cooling solutions.
Source: UNEP, 2021
5.2 Application:
The London Plan 2021 is a comprehensive policy framework that aims to address wide range of pertinent issues within London and these will reflects how the city of London will be shaped in the next coming years, but I’m more interested in the climate change issue policy which is termed as a Global crisis (IPCC, 2024). The latter has been a global phenomenon, the impacts of climate are basically being experienced in all cities of the world where the year 2024 was the hottest year on record and the first with the global average temperature 1.5 degrees Celsius above pre-industrial levels. (WMO, 2024).
The city of London aim to reduce achieve zero carbon by 2050, strategies to mitigate UHI where The effect on temperatures measured in the city has been termed the urban heat island (UHI). ( Philip D. Jones and David H. Lister ,2009), plan to support Urban Resilience, improve air quality, implement sustainable cooling measure, development of flood defence and reduce , reduce green house emission. My own interest lies in seeing how can what I have learnt so far support the London policy plan, sensors deployed on satellites are able to monitor atmospheric pollution and air quality from space. ( Katherine Anderson,Barbara Ryan,William Sonntag,Argyro Kavvada &Lawrence Fried, 2017) for example Studies quantifying the magnitude of the UHI effect have been performed for hundreds of cities around the world (Oke, 1979,Arnfield, 2003,Santamouris, 2015). The method of which could be applied incorporated to the London plan is The Global Surface UHI Explorer these is an interactive web app that could be used to monitor urban heat island (UHI) intensities of practically all urban clusters on Earth. The app is built on the Google Earth Engine platform and allows users to query the UHI data of urban areas using a simple interface. The UHI dataset was created based on the simplified urban-extent (SUE) algorithm detailed in (Chakraborty and Lee, 2019).
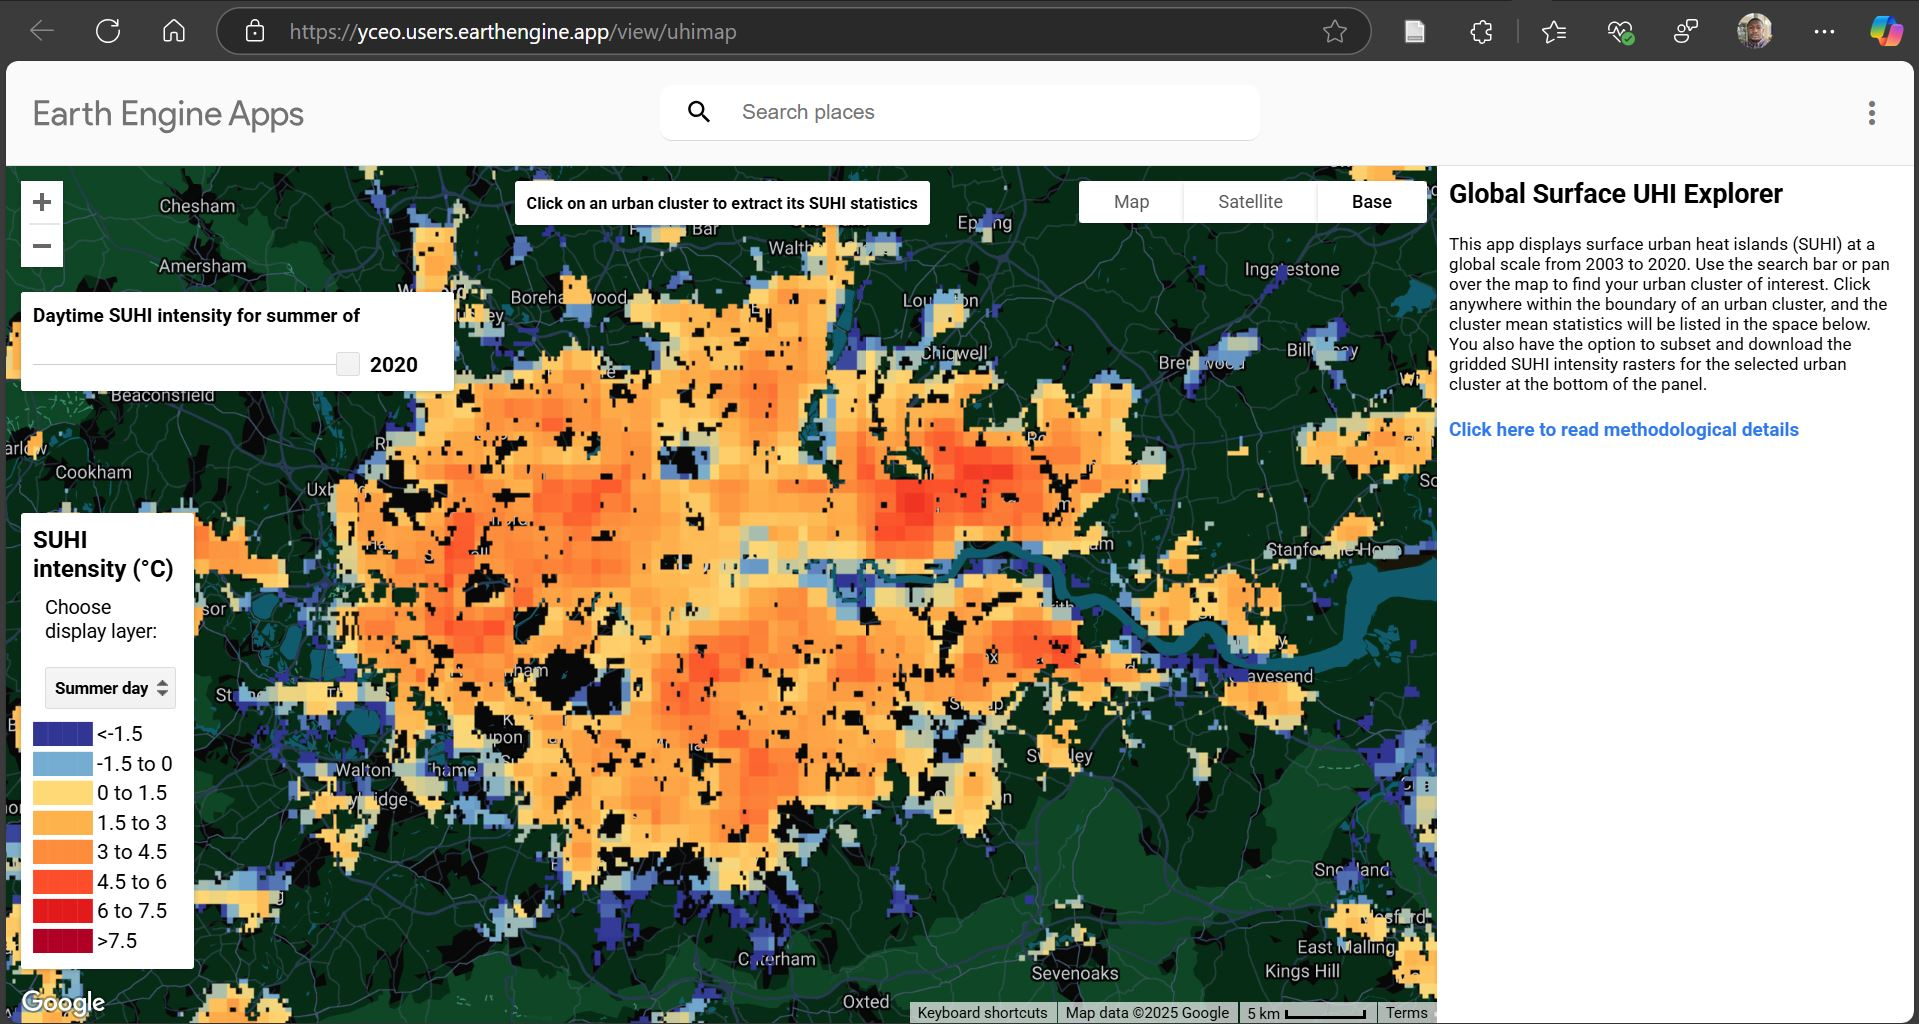
Above you can see where I tried to use the platform over the area of London to map remotely sensed data of London showing real time data of areas, these was developed a new algorithm, the simplified urban-extent (SUE) algorithm, to estimate the surface urban heat island (UHI) intensity at a global scale. We implement the SUE algorithm on the Google Earth Engine platform using Moderate Resolution Imaging Spectroradiometer (MODIS) images to calculate the UHI intensity for over 9500 urban clusters using over 15 years of data, making this one of the most comprehensive characterizations of the surface UHI to date. ( Chakraborty and Lee, 2019.) Through detecting this areas with high emission, UNEP urban development design policy can be incorporated to cool these areas.
5.3 Reflection :
After researching about several cities policies and applications my knowledge of remote sensing is kind of getting wider and I’m realizing true power and applicability of different concepts of remotely sensed data. seeing several application of earth observation application towards climate active and sustainable development goals I feel very hopeful that EO is the solution to solving so many global crisis even though there are several disagreement in literature regarding UHI where a systematic critique of the UHI literature (Stewart, 2011) found that roughly half of the UHI studies lacked robustness. Some important issues were not controlling for weather factors, lack of information on site metadata and instrumentation, lack of accounting for temporal variability during mobile surveys, inconsistency in defining both urban and rural measurement locations, and disregarding the effect of scale. But I feel these critism doesn’t hold any water as eath observation has improved from 2011 till date a lot of things has changed, and more data has been acquired, a justification to my argument is where a EO dashboard is used globally to map different cities experiencing UHI