2 Introduction
Summary: This week, was more like an introductory session for remote sensing where I was introduced to remote sensing and different concepts of remote sensing, starting from electromagnetic spectrum, radiation, wavelength, spectral signature, active and passive sensors, scattering, Raleigh Scattering, Resolution which was categorised into spatial, spectral , temporal and radiometric resolution. data exploration, and then different applications of remote sensing, and lastly, I was introduced to different types of remotely sensed images such as Landsat and sentinel imagery.
Independent thought: I find the spectral signature quite interesting because I believe this could be used to have a rough idea of the components of that area, more like a preliminary approach to learning something within a particular area.
Comment: I feel like remote sensing is quite broad, there are so many topics in the aspects of remote sensing, to be really good one need to have some kind direction or specialty, i mean it’s just the beginning, but I personally feel like there is so much to learn.
2.1 Application:
2.2 Comparative Analysis of TCT Greenness and NDVI for Forest Vegetation Mapping in Natural Park “Blue Stones:
TCT, which stands for tassle cap transformation which I find very interesting and quite related to the topics covered in this week. The paper used Tassle cap transformation methodology to monitor forest vegetation and detect changes in the forest cover from a natural park in Bulgaria. Tasseled Cap Transformation (TCT) methodology was applied using Sentinel-2 satellite images, resulting in three components: “brightness,” “greenness,” and “wetness. They used the”greenness” component to calculate the Normalized Differential Greenness Index (NDGI), and these provides data on forest vegetation dynamics over short and long-term periods (Andrey Stoyanov, 2022) .
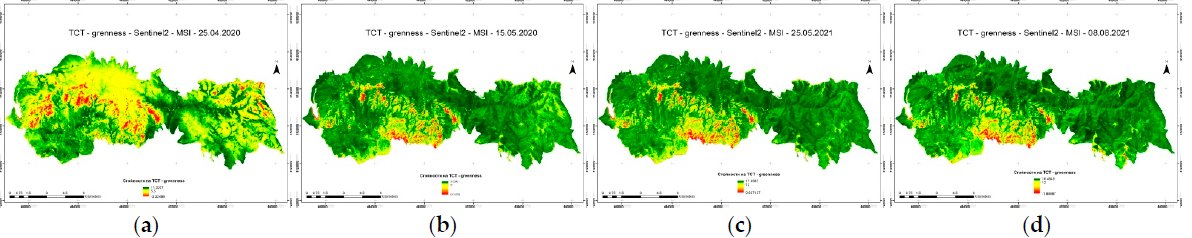 figure 1 displays four maps showing the spatial distribution of the TCT–greenness component values from 2020-2021
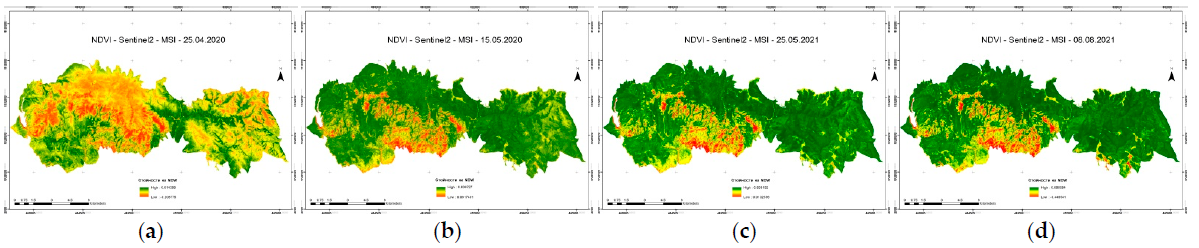 This figure presents four corresponding maps showing the spatial distribution of NDVI values for the exact same dates as in Figure 1
2.3 New Tasseled Cap Classification Technique using Landsat-8 OLI Image Bands
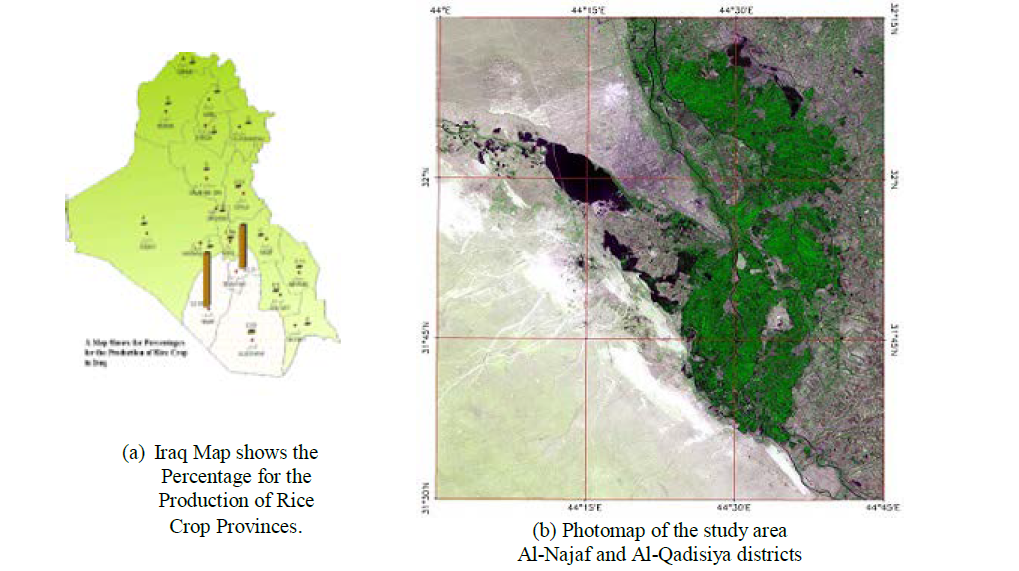
While our previous discussion used sentinel 2 imagery to map changes in forest vegetation over time in the Natural Park “Blue Stones this in contary used Landsat-8 OLI Image Bands , the authors introduces a novel classification approach based on the Tasseled Cap Transformation (TCT) using Landsat-8 Operational Land Imager (OLI) data. The study focuses on quantifying rice cultivation acreage in Al-Najaf and Al-Qadisiya provinces, Iraq’s key rice production regions. TCT coefficients were derived specifically for imagery acquired on September 28, 2013, deemed most suitable for identifying land surface features related to rice fields.
The classification method centers on analyzing scatterplots of TCT Greenness and Brightness components, dividing them into regions corresponding to reflectance values for land cover classification. This approach compresses multispectral data into fewer bands associated with physical scene characteristics, ensuring minimal information loss. Preprocessing included radiometric correction of Landsat-8 OLI images to Top of Atmospheric (TOA) reflectance, and TCT components (Brightness, Greenness, and Wetness) were calculated using weights tailored for OLI bands. (Ali and Salman (2016)
A key aspect of the methodology was the automatic determination of the soil line and boundaries in the Brightness-Greenness scatterplot for classifying land cover types, particularly dense vegetation like rice plantations. The calculated rice acreage (89,589.402 hectares) closely matched the Iraqi Ministry of Agriculture’s reported figure (90,577 hectares), achieving an accuracy of 98.91%. For the Al-Mashkhab region, predictions (9,248.22 hectares) aligned with agricultural office data (8,750 hectares), yielding a 97.86% accuracy for crop production.
Unlike forest monitoring studies that track temporal changes, this research validated a static classification technique for mapping rice cultivation. Its findings emphasize the value of Landsat-8 OLI data and the new TCT-based method in agricultural mapping, with significant implications for food security and resource management. The results may even surpass the accuracy of official agricultural data(Ali and Salman (2016).
2.4 Reflection
By the end of week one, I found that some of the concepts introduced were familiar to me, while others were completely new. I was able to understand the distinct characteristics of Landsat and Sentinel imagery, that Sentinel images have a higher resolution of 10 meters, whereas Landsat imageries are limited to 30 meters.
I also come to appreciate the benefits of the Tasseled Cap Transformation, a technique founded on the principles of greenness, wetness, and brightness. Originally developed by R.J. Kauth and G.S. Thomas in 1976 using Landsat satellite data, this method holds great potential for monitoring changes in forest cover. Furthermore, I believe this approach could be widely adopted by governments, non-governmental organizations, and policymakers to support ecosystem restoration efforts, which is crucial in addressing climate change.